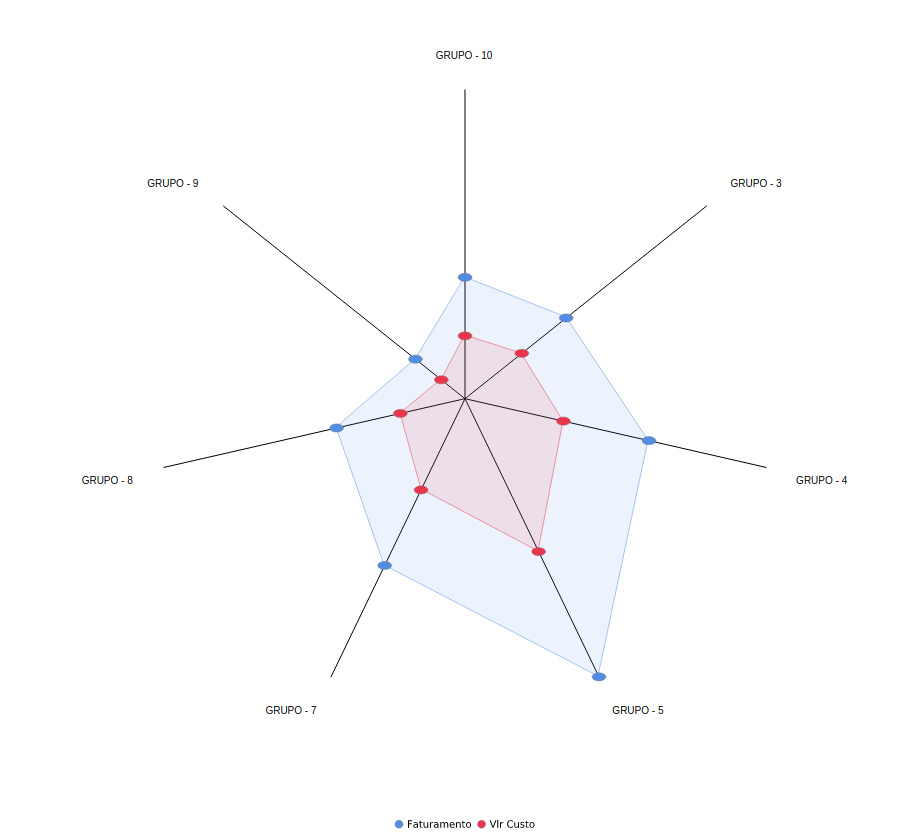
The radar chart is very useful for assessing the breadth of one or more metrics within a set of attributes. Usage examples are very common in scenarios for evaluating grades or points obtained.

See the breadth or distribution of one or more metrics within a series of attributes.

