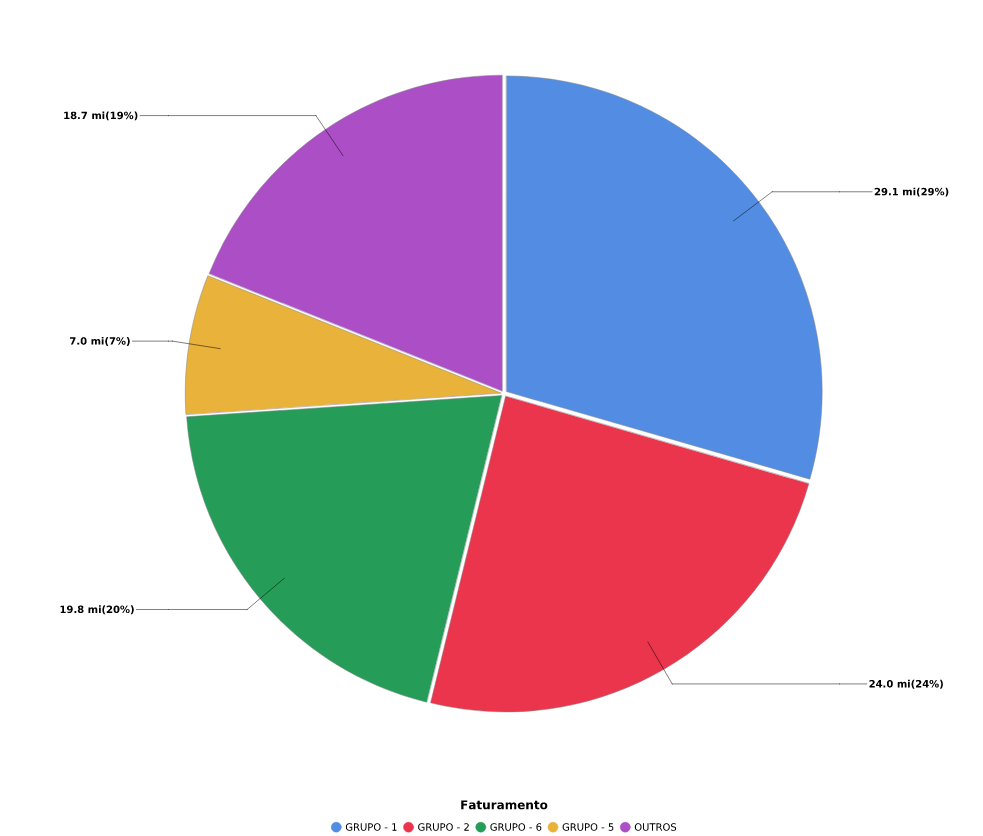
This chart allows you to view in a simple way the participation of the main members of a dimension on a metric, see for example the biggest products billed and their participation on the total.

See in a pie chart the participation of the main members of a dimension over a metric.

