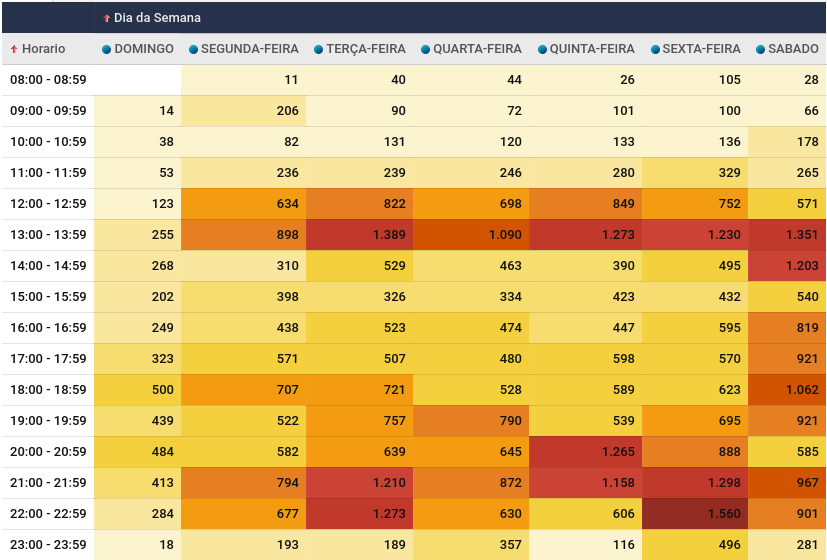
This analysis is ideal for quickly visualizing the highest values in a two-dimensional intersection distribution, check for example which times and days of the week have the greatest movement, or which products your representatives are most focused on selling.

Quickly identify the highest values at the intersection of two dimensions.

